

Student Growth Using Teach to One Roadmaps
October 6, 2023A Case Study in the Efficacy of Individualized Learning
Abstract
In this study, we analyzed the fall and winter 2022 MAP scores of 208 students from one urban middle school. Employing a quasi-experimental matched paired approach, we aimed to identify discrepancies in MAP growth between pairs of closely resembling students. For each Roadmaps user active for at least half the semester, we sought a non-active counterpart in the same grade with similar fall MAP scores, ideally sharing the same class. With these pairs, we assessed the divergence in MAP growth from fall to winter scores.
Out of the 208 student pool, we identified 44 viable matches meeting predefined similarity criteria. Following adjustments for grade, initial fall scores, and classroom dynamics, active Roadmaps participants exhibited 5.6 (p < .01) RIT points of additional MAP growth in their winter assessments as compared to their matched peers. That is the equivalent of an additional one and half semesters of learning demonstrated by students using this program.
Introduction
Roadmaps is a web based tech product developed by Teach to One that is primarily used in a supplementary educational environment for middle school math. The program is used to identify what math skills a student knows using a diagnostic assessment and then recommends the next skills that connect with what they already know. This program is built on the work of New Classroom’s to pursue educational environments that are personalized to the needs of each student.
The analysis outlined in this paper documents a case study that uses fall and winter NWEA MAP assessment scores of two hundred students from one middle school who may or may not have used the program. We use each MAP score as a snapshot of their knowledge to assess how students active in the program learned through the semester as compared to their peers.
MAP is a growth oriented assessment that provides an integer based scoring system to benchmark where a student lands as compared to national standards. This system uses the RIT or Rasch UniT model to provide a linear scale of student achievement. A student’s MAP score represents the level questions that they answer correctly 50% of the time.
This assessment provides greater granularity in student achievement as opposed to typical standards-based state tests which determine if students meet grade level expectations. This distinction is important as many of the students in this school started well below grade level expectations. Standards-based testing is not going to see all the progress that students make in catching up to their grade, while MAP captures that growth.
Using the results of this assessment, it was identified that over half of the students in this school began the year below the 20th percentile of national averages. 25% fell into the 20-40th percentiles. The last 32 students tested around the national average with the highest reaching up to the 82nd percentile. Resulting from this, a rigorous supplemental program was implemented through the fall of 2022 where students had their choice in Roadmaps or another program. Regardless of their choice, the teachers and administrators created a growth oriented culture that celebrated skill acquisition and pushed the students to maximize their opportunity. Given this environment, we saw an opportunity for a natural experiment comparing the students that used Roadmaps to those that did not. Following this semester, the school pivoted to exclusively preparing the students for the end of year state test, ending the environment that supported this analysis.
Methods
Taking 61 students who were active for at least half the semester in Roadmaps, we used a k-nearest neighbor matching process (with replacement) [1] to find the most similar partner who was not active in the program. Using the methodology outlined in Austin, [2] matches were limited to those within a suitable level of similarity, leaving unmatched students to be dropped.
These matches were created over three similarity factors. First, each pair had to be in the same grade. Second, they must have a similar Fall MAP score. Third, if available we prioritized students being in the same classroom environment. This matching process is done to minimize the potential for confounding variables. Matching on grade and classroom environment reduces the potential for biases from different educational methodologies and experiences. Controlling for the fall starting point leads to matches of students with similar aptitudes and attitudes towards math up to that point of their education.
Student progress over the semester was tracked with RIT point growth, calculated by subtracting their fall from the winter MAP scores. The resulting values were then compared for each pair and averaged to calculate the mean difference in RIT growth between active and non-active students.
Results
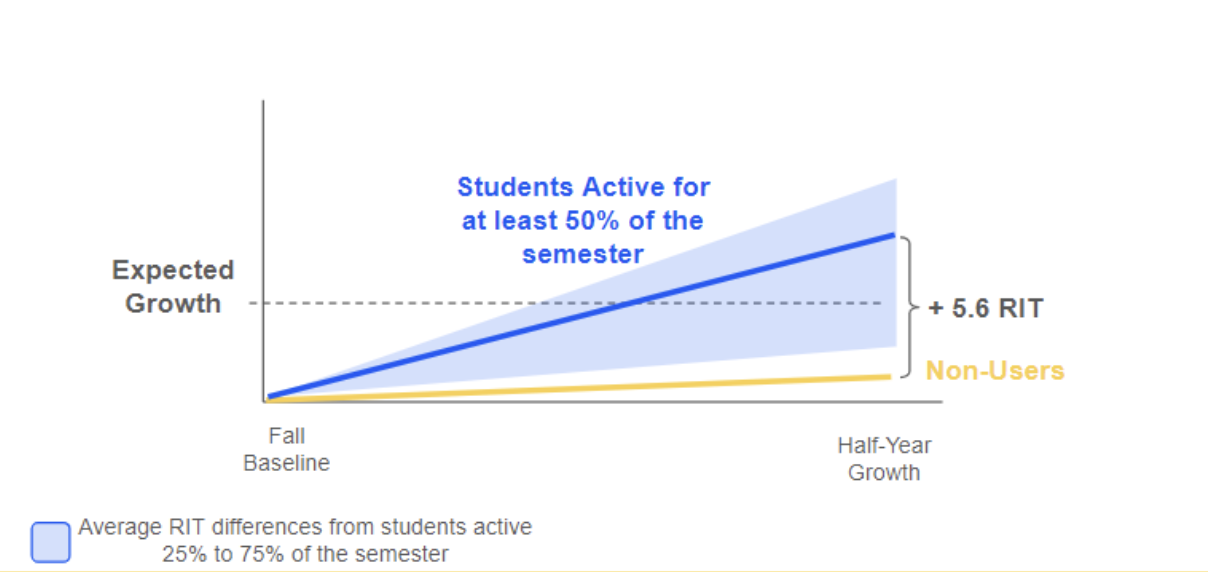
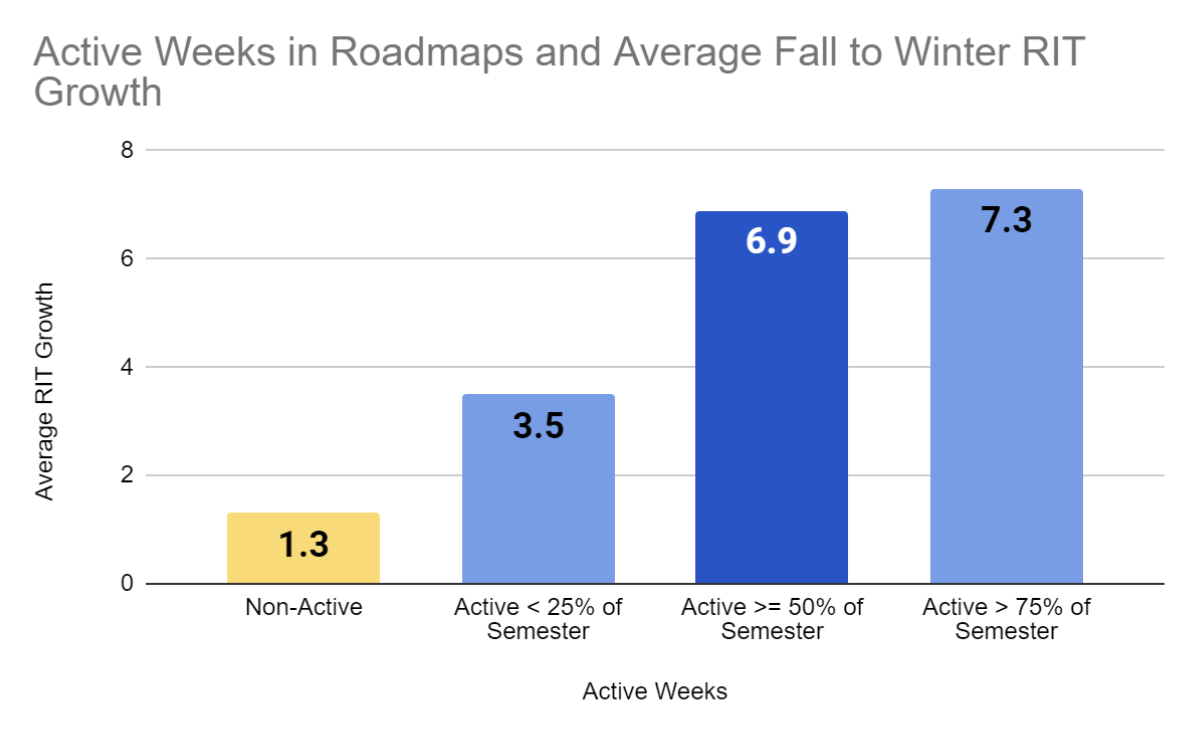
Out of the 61 students active for at least half the semester, 44 were found to have matches with no time in Roadmaps that met adequate similarity thresholds. Students not active in the program grew by an average of 1.3 RIT points over the semester. Active Students grew by an average of 6.9 RIT points over the same time. Within each pair of students, the average difference in growth (p-value <.01) was 5.6 RIT points with a standard deviation of 3.7 RIT points. This resulted in a Cohen’s D of .46.
This 5.6 RIT difference can be contextualized using the NWEA’s national growth norms [3] which state that over the fall semester the average 6th grader grows by 4.83, 7th graders by 3.83 and 8th graders by 3.20 RIT points. This means that students active in this program are progressing well past the national averages while comparable inactive students fell short. On this basis, the 5.6 additional points represent a semester and half of what is expected for students to learn over that semester.
Beyond the main results of our test group, we can also see that students with either more or less activity show evidence of corresponding changes in effect sizes. Students with less time in Roadmaps saw a less pronounced increase while students active for more time showed even better results.
Discussion
These results provide statistically significant evidence of Roadmaps’ influence on student education. This school’s experience of seeing an additional semester and half of increased learning is a very strong response to individualized education, even in a supplemental format. Finding a p-value less than .01 gives us very strong statistically significant evidence that students active in Roadmaps grow more than their non-active peers.
Despite the extent of the average impact, finding a Cohen’s D of .46 gives us an indication of the variability in the underlying data. This medium impact indicates the extent to which the standard deviation of the pooled sample size shows that individual student outcomes will still vary despite the confidence in the positive effect on the aggregate population. We can be confident that a school will see a positive impact from effective Roadmaps usage.
Further, by investigating students who were active for more or less than six weeks, we saw evidence that the amount of time spent with this program had a positive association with outcomes. Students with less Roadmaps usage saw reduced impact while students active for three quarters of the semester demonstrated an even larger effect. However, these population sizes are too small to overcome the variability so we are not able to establish statistically significant correlation. Nonetheless, we believe this can be achieved with an increased sample size and will be an area of further research.
Conclusion
Based on 2022 fall-to-winter MAP data from one middle school, we found statistically significant evidence that Roadmaps students grow more than their non-Roadmaps peers. Using a paired analysis of matching peers, active Roadmaps students demonstrated 5.6 more RIT points, i.e. more than a semester and a half of additional growth, when compared to their non-Roadmaps peers. Further, higher Roadmaps use was associated with even higher relative growth. This case study shows exciting evidence that this program’s usage has a strong association with positive student outcomes. While it only represents the outcomes of this one school’s experience, it provides strong motivation for continued development of the product and expansion of this study’s population size.
Citations
1. A. Kline and Y. Luo, PsmPy: A Package for Retrospective Cohort Matching in Python, 2022 44th Annual International Conference of the IEEE Engineering in Medicine & Biology Society (EMBC), 2022, pp. 1354-1357, doi: 10.1109/EMBC48229.2022.9871333.
2. Austin, P. C. (2011). Optimal caliper widths for propensity‐score matching when estimating differences in means and differences in proportions in observational studies. Pharmaceutical Statistics, 10(2), 150–161. https://doi.org/10.1002/pst.433
3. NWEA. (2020). 2020 NWEA Map Growth Normative Data Overview – teach.mapnwea.org. 2020 NWEA MAP Growth normative data overview. https://teach.mapnwea.org/impl/MAPGrowthNormativeDataOverview.pdf